
Page 12 - ISLA_SLReport_Aug2020_double
P. 12
transactions (at least in the short term). This was Not unexpectedly, the past six months have also seen Many companies suspended dividend payments, leading
combined with some evidence of lenders changing both considerable earnings volatility across the industry. to what many describe as an essentially specials-based
collateral composition and haircut levels, as they sought Information recently released by DataLend underlines business. Quite simply if you held specific stocks in
to manage risk profiles particularly around less liquid the difficult trading conditions, with overall revenues your lending portfolio, then there were significant
From a securities lending asset classes such as non-investment grade issues. In in the lender-to-broker markets reported at $3.89 opportunities. Many of these specific situations centred
perspective, overall activity addition, there was some evidence of a small number 2019. Despite overall revenues being depressed across around those companies and sectors where the impacts
billion, some 14% down from the comparable period in
of COVID-19 were being felt the most, such as airlines
of institutional investors either withdrawing from the
returned to more normal levels, market or restricting their activity at this time. This is both equity and fixed income markets, the lending of and hospitality. Wirecard was a notable exception.
with outstanding on-loan perhaps not that unexpected, although it is important government bond High Quality Liquid Assets (HQLA) From an overall market perspective, we have tracked
held up well, as market participants sought to secure
to stress that we did not see the large number of
for some time the relationship between assets that
balances closing the six month institutional clients suspending programmes as was seen these assets for multiple trading, balance sheet and are made available by institutional investors in lending
period at €2.2 trillion in 2007/08. collateral purposes. The decision of many corporates to programmes, and loan balances from the perspective of
cancel dividend payments to shareholders, most likely the types of funds participating across the industry. As
As markets returned to some sort of normality, the had a knock on impact to securities lending markets as the following charts demonstrate, we continue to see
To put this in context, during the period between 19 dovish sentiments and stance from central banks helped demand to borrow equities reduced. disparity between the two.
February and 23 March, the S&P 500 fell by over 33%, ease liquidity concerns. The continued stimulus resulting
highlighting the intrinsic link between lending pools in excess cash in the system, allowed banks to roll
and market valuations. From an on-loan perspective, off excess funding taken on at the height of the crisis,
balances rose steadily out of the year-end restrictions thereby lowering their overall cost of funding. From a 8 %
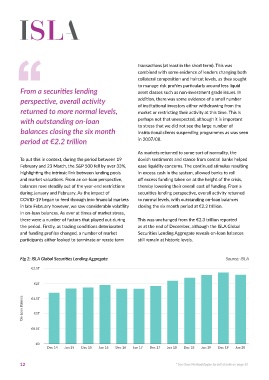
during January and February. As the impact of securities lending perspective, overall activity returned
COVID-19 began to feed through into financial markets to normal levels, with outstanding on-loan balances 9% 25%
in late February however, we saw considerable volatility closing the six month period at €2.2 trillion. 8
in on-loan balances. As ever at times of market stress,
there were a number of factors that played out during This was unchanged from the €2.3 trillion reported Fig 3:
the period. Firstly, as trading conditions deteriorated as at the end of December, although the ISLA Global Global Lendable Supply Value
and funding profiles changed, a number of market Securities Lending Aggregate reveals on-loan balances By Fund Type
participants either looked to terminate or rerate term still remain at historic levels.
Source: DataLend 9%
16%
Fig 2: ISLA Global Securities Lending Aggregate Source: ISLA 6%
€2.5T 44% 34%
€2T Fig 4:
Global Securities On-Loan
By Fund Type (Lender to Broker)
On-Loan Balance €1T Source: DataLend
€1.5T
22%
Pension Plans
Government/Sovereign Entities
€0.5T
Collective Investment Vehicle
Insurance Companies 29%
€0
Dec 14 Jun 15 Dec 15 Jun 16 Dec 16 Jun 17 Dec 17 Jun 18 Dec 18 Jun 19 Dec 19 Jun 20 Others
12 * See Data Methodologies for full details on page 50 13