
Page 49 - ISLA_SLReport_Aug2020_double
P. 49
Following the 2007/08 crisis, corporate bonds fell out of Another factor that can tell us something about the collateral here in Europe. This has risen from 10% of all
favour as a collateral class, as some lenders experienced underlying cash and investment markets that sit behind government bond collateral in December, to just under
liquidity issues when trying to sell off against positions securities lending collateral pools, is the dispersal of 30% in June - a threefold increase.
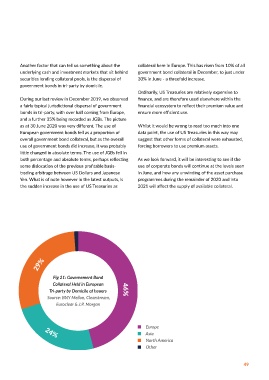
held with defaulting counterparties. Since then, there government bonds in tri-party by domicile.
Sentiment appears to have has been an apparent reluctance to embrace corporate Ordinarily, US Treasuries are relatively expensive to
changed in the past six bonds as collateral. During our last review in December 2019, we observed finance, and are therefore used elsewhere within the
a fairly typical jurisdictional dispersal of government
financial ecosystem to reflect their premium value and
months with corporate Sentiment appears to have changed in the past six bonds in tri-party, with over half coming from Europe, ensure more efficient use.
bonds now accounting 34% of all collateral held in tri-party. This is up from and a further 35% being recorded as JGBs. The picture Whilst it would be wrong to read too much into one
months with corporate bonds now accounting for
as at 30 June 2020 was very different. The use of
for 34% of all collateral the 10% reported in December 2019, and is the European government bonds fell as a proportion of data point, the use of US Treasuries in this way may
highest concentration of this asset class we have seen
held in tri-party. This is up since we started following these particular statistics overall government bond collateral, but as the overall suggest that other forms of collateral were exhausted,
forcing borrowers to use premium assets.
use of government bonds did increase, it was probably
from the 10% reported in in 2015. little changed in absolute terms. The use of JGBs fell in
both percentage and absolute terms, perhaps reflecting
December 2019, and is The increasing prevalence of corporate bonds is likely some dislocation of the previous profitable basis- As we look forward, it will be interesting to see if the
use of corporate bonds will continue at the levels seen
the highest concentration to have led to higher levels of over collateralisation for trading arbitrage between US Dollars and Japanese in June, and how any unwinding of the asset purchase
of this asset class we have borrowers, as lenders would have demanded higher Yen. What is of note however in the latest outputs, is programmes during the remainder of 2020 and into
2021 will affect the supply of available collateral.
the sudden increase in the use of US Treasuries as
risk buffers to negate the liquidity risks associated with
seen since we started accepting this asset class. The use of corporate bonds
following these particular sought a more appropriate risk/reward ratio for
may well have also led to higher fee levels, as lenders
statistics in 2015 these transactions.
What is not clear at this point is if this is a temporary
Not unexpectedly as equity markets came under shift away from equities towards corporate bonds, or
pressure, with falling valuations, increased volatility, whether this is a more permanent feature. We are aware
and a fall-off in equity positions held by hedge funds, that many hedge funds have actively sought to take
the proportion of equities being posted as collateral positions in the corporate bond sector, and therefore
fell dramatically to only 13% of all collateral. In the some of these assets may well be finding their way into
past where we have seen a decline in the use of equity collateral pools. 29%
collateral, we have normally expected it to be replaced
with government bonds. Whilst the use of government The data we have does not tell us anything about the Fig 21: Governement Bond
bonds increased from 45 to 52% of all collateral pledged, quality or liquidity of these assets, but we do know Collateral Held in European
it was not enough to cover all of the shortfall. As asset historically that corporate bonds sometimes trade Tri-party by Domicile of Issuers 46%
buy-back programmes pulled securities out of the less freely than mainstream equities or government Source: BNY Mellon, Clearstream,
markets, and many underlying institutional investors bonds. This liquidity risk may well be managed by Euroclear & J.P. Morgan
liquidated their holdings of government bonds, they lenders or their agents through higher levels of over
appeared less prominent within the collateral eco- collateralisation (haircut), together with specific
system than expected. concentration limits to avoid lenders holding too Europe
much of a given issuer or issue. We will of course 24% Asia
The most unexpected change in the last six months has continue to monitor this particular data set over the North America
been the renewed use of corporate bonds as collateral. coming months. Other
48 49