
Page 24 - ISLA_SLReport_Aug2020_double
P. 24
Global Government Bond Markets in Focus Fig 7: US Treasury Bonds On-Loan Source: DataLend
700B
The first six months of the year have provided an As we moved into late February, and whilst markets
almost unique opportunity to observe how financial had brushed off much of the concerns around
markets react to external forces, and how factors COVID-19, the progressive implementation of mass
other than simple economic fundamentals can lockdowns in Italy changed the mood; a realisation 600B
rapidly change sentiment. that this crisis was now at the heart of Europe, US Treasury Loan Balance (Quantity)
and not a contained event in Asia. This previous
During 2020, we have been able to see the complacency quickly turned into the so-called ‘dash
COVID-19 pandemic develop through the lens of for cash’, as investors sought to secure access to
our debt and equity markets. cash and cash equivalent assets. Elsewhere, the
impacts of the growing pandemic were being felt 500B
During January and February, we saw a steady rise in the US Treasury markets, with unexpected yield Jan 20 Feb 20 Mar 20 Apr 20 May 20 Jun 20 Jul 20
in both availability as well as the on-loan balances volatility suggesting structural issues. The week
of government bonds. Investors appeared to be of 9 March essentially defined much of what was
stockpiling high quality low risk assets as a possible going to happen during the rest of the month and From an on-loan perspective, we did see a marked Traditionally, securities lending has been viewed
reaction to the growing concerns around the into April. A sudden collapse in oil prices sparked increase in the demand to borrow government bonds, as a source of secondary market liquidity,
spread of the virus, particularly after the World by falling demand in China ann tensions between with balances increasing significantly between the end therefore this is likely to be an important element
Health Organization declared a global health leading producers Russia and Saudie Arabia, raised of February and mid to late March. Further review of the of this increase.
emergency on 30 January. This led to a rise in important questions about the stability of many data (Fig 7) confirms that this demand pull was almost
reported government bonds being made available other emerging economies. This in turn led to central exclusively associated with an increase in demand to It is perhaps interesting to note that as the full impact
for lending by some 15%, from €3 to €3.4 trillion banks selling US Treasuries to raise dollars to defend borrow US Treasuries. of some of the US Fed’s further liquidity interventions
between 1 January and the end of the two month their currencies in anticipation of a deepening began to come into play, some of this incremental
period. In that early part of the year, on-loan crisis. Elements of this sell-off can be clearly seen Although the exact reasons for this spike in demand demand did fall away.
balances built steadily as banks sought to rebuild in the following chart (Fig 6), with some €400 will be varied and complex, they are likely to be closely
supplies of HQLA assets that had been constrained billion of government bonds flowing out of lending associated with the reported structural liquidity issues In Europe, the picture (as highlighted in Fig 8) was
over the year-end. programmes between 9 March and mid-April. being socialized at that time. somewhat different.
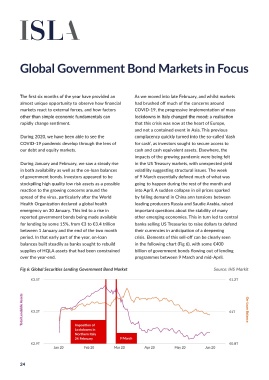
Fig 6: Global Securities Lending Government Bond Market Source: IHS Markit Fig 8: European Securities Lending Government Bond Market Source: IHS Markit
€3.5T €1.2T €1.1T €0.4T
Total Lendable Assets €3.2T €1T On-Loan Balance Total Lendable Assets €0.95T €0.3T On-Loan Balance
Imposition of
Lockdowns in
Northern Italy
24 February 9 March
€2.9T €0.8T €0.80T €0.2T
Jan 20 Feb 20 Mar 20 Apr 20 May 20 Jun 20 Jan 20 Feb 20 Mar 20 Apr 20 May 20 Jun 20
24 * See Data Methodologies for full details on page 50 25