
Page 27 - ISLA_SLReport_Aug2020_double
P. 27
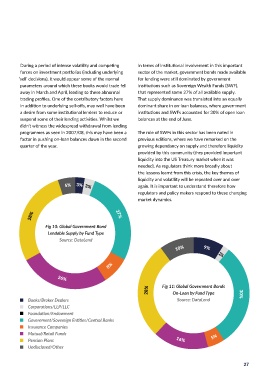
that markets across Europe did not see some of the   During a period of intense volatility and competing   In terms of institutional involvement in this important
 market dislocation seen in North America, where lending   forces on investment portfolios (including underlying   sector of the market, government bonds made available
 markets were used to provide much needed liquidity.  ‘sell’ decisions), it would appear some of the normal   for lending were still dominated by government
        parameters around which these books would trade fell   institutions such as Sovereign Wealth Funds (SWF),
 In terms of institutional   Government bond lending has over time moved   away in March and April, leading to these abnormal   that represented some 27% of all available supply.
 involvement in this important   towards a non-cash collateral market, where   trading profiles. One of the contributory factors here   That supply dominance was translated into an equally
                                                  dominant share in on-loan balances, where government
 borrowers collateralise loan positions with other
        in addition to underlying sell-offs, may well have been
 sector of the market,   securities. This has been especially true in Europe   a desire from some institutional lenders to reduce or   institutions and SWFs accounted for 30% of open loan
 government bonds made   where regulation restricts the acceptance of cash   suspend some of their lending activities. Whilst we   balances at the end of June.
        didn’t witness the widespread withdrawal from lending
 collateral securities lending (UCITs) are constrained
 available for lending were still   on investing beyond 7 days. Historically, non-cash   programmes as seen in 2007/08, this may have been a   The role of SWFs in this sector has been noted in
 trades have been predominantly regulatory driven,
 dominated by government   with borrowers looking to use high risk weighted   factor in pushing on-loan balances down in the second   previous editions, where we have remarked on the
                                                  growing dependancy on supply and therefore liquidity
        quarter of the year.
 institutions such as Sovereign   assets (RWA) such as equities, to secure HQLA   provided by this community (they provided important
 Wealth Funds (SWF), that   balance sheet friendly government bonds. When these   needed). As regulators think more broadly about
                                                   liquidity into the US Treasury market when it was
 trades are combined with a term element of three
 represented some 27% of all   months or more, the HQLA assets may be used as   the lessons learnt from this crisis, the key themes of
 available supply  part of the borrowers Liquidity Coverage Ratio (LCR)   liquidity and volatility will be repeated over and over
 calculation. This has meant that borrowers and to an   5%  3% 3%  again. It is important to understand therefore how
 extent lenders, have prioritised these trades over key   regulators and policy makers respond to these changing
 regulatory reporting dates (such as year or quarter   market dynamics.
 Whist we saw a significant reported outflow of   ends). In general and notwithstanding the lower
 European government bonds from lending programmes,   concentration of cash collateralised trades across this   27%
 which is very much in line with what was happening in   market, it has tended to be these trades that have   28%
 North America, we did not see a corresponding uptick in   therefore been reduced or returned first. When we   Fig 10: Global Government Bond
 on-loan positions. The drivers behind this view are likely   examine the first half of 2020 however, we see the   Lendable Supply by Fund Type
 to be varied, but the absence of the sudden demand to   exact reversal of this trend, with cash collateralised   Source: DataLend
 borrow additional European government bonds suggests   loans remaining fairly constant over the period.  10%  9%

                                                                               2%
                                        8%
 Fig 9: Global Securities Lending Government Bond Market - Cash Versus Non-Cash    Source: IHS Markit
 €320B  €880B         26%
                                                      28%  Fig 11: Global Government Bonds    30%
                                                               On-Loan by Fund Type
 On Loan Balance vs Cash  €270B  €810B  On-Loan Balance vs Non-Cash  Corporations/LLP/LLC
                                                                Source: DataLend
           Banks/Broker Dealers
           Foundation/Endowment
           Government/Sovereign Entities/Central Banks
           Insurance Companies
           Mutual/Retail Funds                                               5%
           Pension Plans                                        16%
 €220B  €740B
 Jan 20  Feb 20  Mar 20  Apr 20  May 20  Jun 20  Undisclosed/Other


 26                                                                                     27