
Page 40 - ISLA_SLReport_Aug2020_double
P. 40
however try and deduce some sense from the In line with our observations across fixed income
trends we have seen. First, in early January and markets and by historical standards, it is apparant
February we saw some seasonality in equity books, as that within equity lending cash collateral loans
borrowers looked to build up positions ahead of the appeared more stable than those collateralised with
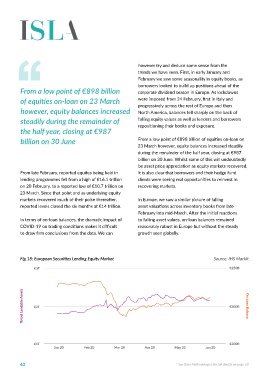
From a low point of €898 billion corporate dividend season in Europe. As lockdowns other securities. As the following chart highlights, Recent data released by DataLend
of equities on-loan on 23 March were imposed from 24 February, first in Italy and loans against cash collateral marginally increased has indicated that revenues
progressively across the rest of Europe and then
into 30 June, whilst non-cash collateralised trades
however, equity balances increased North America, balances fell sharply on the back of appeared more volatile and fell into the half year end. derived from cash collateral
steadily during the remainder of falling equity values as well as lenders and borrowers The pronounced ‘V’ shape pattern seen around reinvestment activities doubled in
repositioning their books and exposure.
the half year, closing at €987 non-cash trades between mid-February and the first half of 2020, compared
billion on 30 June From a low point of €898 billion of equities on-loan on mid-April may be explained in part by the extreme with the same period in 2019
23 March however, equity balances increased steadily market conditions, leading to clients pulling back
during the remainder of the half year, closing at €987 from lending, combined with borrowers looking to
billion on 30 June. Whilst some of this will undoubtedly reposition their loan books (including the mix of Although we have seen to some extent a recovery in
be asset price appreciation as equity markets recovered, collateral pledged against loans). equity lending, it has become something of a specials
From late February, reported equites being held in it is also clear that borrowers and their hedge fund market, with intense activity around a limited range of
lending programmes fell from a high of €16.1 trillion clients were seeing real opportunities to reinvest in Another factor in play here could have been enhanced names that are primarily associated with those industries
on 20 February, to a reported low of €10.7 trillion on recovering markets. cash collateral reinvestment returns, that may have and sectors most affected by the pandemic. A notable
23 March. Since that point and as underlying equity drawn in lenders (especially in North America) to actively exception in that list is Wirecard, which prompted
markets recovered much of their poise thereafter, In Europe, we saw a similar picture of falling opt to receive cash collateral. considerable debate and coverage in the first half of
reported levels closed the six months at €14 trillion. asset valuations across inventory books from late the year. It is not within the remit of this publication to
February into mid-March. After the initial reactions Recent data released by DataLend has indicated that comment further on this owing to the impending legal
In terms of on-loan balances, the dramatic impact of to falling asset values, on-loan balances remained revenues derived from USD cash collateral reinvestment actions, however we would highlight the market scrutiny
COVID-19 on trading conditions makes it difficult reasonably robust in Europe but without the steady activities doubled in the first half of 2020, compared offered by short sellers as a fundamental and essential
to draw firm conclusions from the data. We can growth seen globally. with the same period in 2019. part of any broadly-based capital market.
Fig 18: European Securities Lending Equity Market Source: IHS Markit Fig 19: Global Securities Lending Equity Market Source: IHS Markit
€3T €250B €480B €600B
Totoal Lendable Assets €2T €200B On-Loan Balance On-Loan Balance vs Cash €240B €580B On-Loan Balance vs Non-Cash
€1T €200B €0 €560B
Jan 20 Feb 20 Mar 20 Apr 20 May 20 Jun 20 Jan 20 Feb 20 Mar 20 Apr 20 May 20 Jun 20
40 * See Data Methodologies for full details on page 50 * See Data Methodologies for full details on page 50 41