
Page 11 - ISLA_SLReport_Sep2019
P. 11
Securities being made available by institutional investors Dollars driving the demand to borrow US Treasuries,
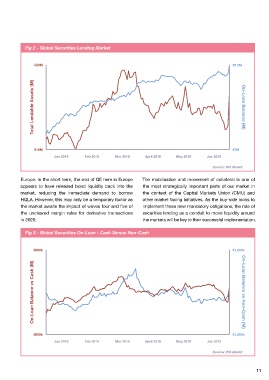
Fig 2 - Global Securities Lending Market
for lending showed a notable increase from €16.6 to and the financing of long equity positions via collateral
€19.6 trillion, an increase of some 18% over the period. upgrade trades.
Whilst we saw a 15% increase in the Dow Jones Industrial €20M €2.2M
Index over the period, accounting in part for the increase Further review of the composition of trading books
in equity valuations, this is perhaps only part of the story. and the use of cash or other securities (non-cash) as
collateral, highlights how institutions actively and at times
Government bonds being made available for lending aggressively manage to various regulatory or market
increased by over 13% to €2.8 trillion. There is clear constraints. As highlighted in Fig 3, we saw the typical
evidence of increased bond issuance more broadly as relationship between cash and non-cash collateral as the Total Lendable Assets (M) On-Loan Balance (M)
issuers look to take advantage of record low yields. In market moved to adjust balance sheet and exposures
addition, new or previously un-lent assets have entered ahead of the 30 June reporting checkpoint. Loans
programmes, as investors look to enhance revenue in the collateralised with cash collateral were either being
low or even negative yield environment. returned or recalled ahead of non-cash loans.
Set against a backdrop of broadly flat equity supply and The reasons behind this trend are now well understood,
€16M €2M
a notable increase in the availability of government bonds with banks often preferring to keep HQLA regulatory driven
Jan 2019 Feb 2019 Mar 2019 April 2019 May 2019 Jun 2019
within the system, the ISLA Global Securities Lending non-cash trades open over the reporting date, preferring
Aggregate (Fig 1*) remained broadly unchanged at circa to scale back equity positions. There is also a preference Source: IHS Markit
€2.2 trillion compared to the 31 December 2018. to return cash collateralised loans to avoid having to
engage in reinvestment markets, at a point when liquidity Europe. In the short term, the end of QE here in Europe The mobilisation and movement of collateral is one of
As we have seen from previous reports, banks and and investment opportunities could be limited. Typically, appears to have released bond liquidity back into the the most strategically important parts of our market in
other prudentially regulated firms appear to be better borrowers want to maintain regulatory driven HQLA market, reducing the immediate demand to borrow the context of the Capital Markets Union (CMU) and
prepared to hit various regulatory reporting hurdles over trades over the year end, as part of an active balance HQLA. However, this may only be a temporary factor as other market facing initiatives. As the buy-side looks to
key reporting dates. Increasingly, as regulators demand sheet management strategy where the LCR is the primary the market awaits the impact of waves four and five of implement these new mandatory obligations, the role of
average reporting or daily compliance, quarter or year binding constraint. the uncleared margin rules for derivative transactions securities lending as a conduit to move liquidity around
end pressure will disappear. However, we did see some in 2020. the markets will be key to their successful implementation.
interesting volatility in terms of trading volumes during These trades are in turn often collateralised with other
the period, and in particularly the final days of the securities which are themselves balance sheet efficient Fig 3 - Global Securities On-Loan - Cash Versus Non-Cash
quarter (Fig 2). if pledged as collateral as part of a term HQLA trade
structure. As we have already noted, there was something
€900k €1,500k
After some seasonality in trading volumes in the early of an anomaly in fixed income markets just prior to
months of the year, we saw general deleveraging the half year that saw increased levels of borrowing
across the market over the six month period, with less of government bonds. As Fig 3 highlights, the market
need for financing and consequently less pressure perhaps off the back of a sudden change of sentiment or
on yields/fees. This stemmed from actions taken over trading opportunity, seemed equally prepared to use both
the 2018 year end and into 2019, where hedge funds types of collateral over the turn in this particular case.
took off risk positions. Furthermore, the fact that banks On-Loan Balance vs Cash (M) On-Loan Balance vs Non-Cash (M)
are generally well positioned for Liquidity Coverage Although we saw small falls in both the absolute level
Ratio (LCR) compliance, means less need to reverse of government bond lending as well as the percentage
in HQLA into the reporting date. The sudden spike (45% to 43%) over the period, the intrinsic link between
in on-loan balances in the final days of the half year, securities lending markets and the broader capital
was almost exclusively related to government bonds. markets it still clear. Some of the apparent fall in the
Although the reasons behind this sudden increase will demand to borrow government bonds probably relates €600k €1,200k
be considered further in a subsequent section, this to either firms better managing their own balance sheets Jan 2019 Feb 2019 Mar 2019 April 2019 May 2019 Jun 2019
is most likely related to a combination of reasons; the and inventories thereby reducing external demand or
liquidity premium often associated with holding US the rolling impact of the end of the ECB’s QE program in Source: IHS Markit
10 11