
Page 12 - ISLA_SLReport_Sep2019
P. 12
ISLA has for some time highlighted the disparity between In particular, our Master Agreements already provide for a
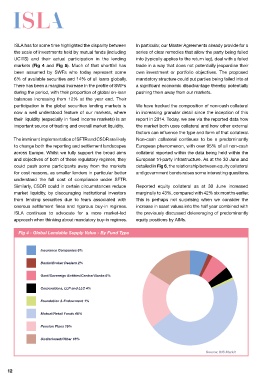
Fig 5 - Global Securities On-Loan - By Fund Type
the scale of investments held by mutual funds (including series of clear remedies that allow the party being failed
UCITS) and their actual participation in the lending into (typically applies to the return leg), deal with a failed
markets (Fig 4 and Fig 5). Much of that shortfall has trade in a way that does not potentially jeopardise their Insurance Companies 6%
been assumed by SWFs who today represent some own investment or portfolio objectives. The proposed
6% of available securities and 14% of all loans globally. mandatory structure could put parties being failed into at Banks/Broker Dealers 8%
There has been a marginal increase in the profile of SWFs a significant economic disadvantage thereby potentially
during the period, with their proportion of global on-loan pushing them away from our markets. Govt/Sovereign Entities/Central Banks 14%
balances increasing from 12% at the year end. Their
Corporations, LLP and LLC 4%
participation in the global securities lending markets is We have tracked the composition of non-cash collateral
now a well understood feature of our markets, where in increasing granular detail since the inception of this
Foundation & Endowment 1%
their liquidity (especially in fixed income markets) is an report in 2014. Today, we see via the reported data how
important source of trading and overall market liquidity. the market both uses collateral and how other external
Mutual/Retail Funds 18%
factors can influence the type and form of that collateral.
The imminent implementation of SFTR and CSDR are likely Non-cash collateral continues to be a predominantly
Pension Plans 29%
to change both the reporting and settlement landscapes European phenomenon, with over 95% of all non-cash
across Europe. Whilst we fully support the broad aims collateral reported within the data being held within the Undisclosed/Other 20%
and objectives of both of these regulatory regimes, they European tri-party infrastructure. As at the 30 June and
could push some participants away from the markets detailed in Fig 6, the relationship between equity collateral Source: IHS Markit
for cost reasons, as smaller lenders in particular better and government bonds raises some interesting questions.
understand the full cost of compliance under SFTR. Even ten years after the crisis, lenders still appear Here, the ongoing USD cross currency basis
Similarly, CSDR could in certain circumstances reduce Reported equity collateral as at 30 June increased uncomfortable with the concept of accepting corporate opportunities led to a demand for HQLA trades against
market liquidity, by discouraging institutional investors marginally to 43%, compared with 42% six months earlier. bonds as collateral. JGB collateral.
from lending securities due to fears associated with This is perhaps not surprising when we consider the
onerous settlement fines and rigorous buy-in regimes. increase in asset values into the half year combined with Consequently, the marginal increase in equity collateral This in part was reflected in the overall reported government
ISLA continues to advocate for a more market-led the previously discussed deleveraging of predominantly was broadly matched against a reported fall in the use of bond collateral, of which some 38% was classified
approach when thinking about mandatory buy-in regimes. equity positions by AIMs. government bonds. as Asian.
Fig 4 - Global Lendable Supply Value - By Fund Type Fig 6 - European SL Collateral Held in European Tri-party
Insurance Companies 6%
Banks/Broker Dealers 2%
Govt/Sovereign Entities/Central Banks 6%
Corporations, LLP and LLC 4%
Foundation & Endowment 1% Equities 43%
Mutual/Retail Funds 46% Corporate Bonds 10%
Pension Plans 19% Government Bonds 46%
Undisclosed/Other 16% Other 1%
Source: IHS Markit Source: Clearstream, Euroclear, JP Morgan, BNY Mellon
12 13