Page 22 - ISLA_SL_Market_Report_H1_2024_-_Final
P. 22

22                                                                                                                                                                                                                        23

                 Securities Lending Market Report | H1 2024


     >>>    Collateral


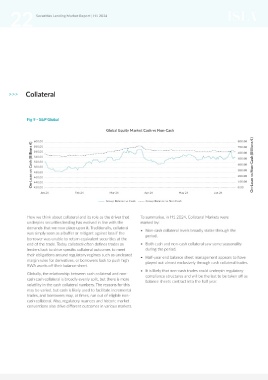
             Fig 9 - S&P Global                                                                                                Fig 10 - S&P Global

                                                Global Equity Market Cash vs Non-Cash                      800.00                 410.00                       North American Equity Market Cash vs Non-Cash                 330.00


               On-Loan vs Cash (Billions €) 600.00                                                         700.00 On-Loan vs Non-Cash (Billions €)  On-Loan vs Cash (Billions €) 420.00                                      310.00 On-Loan vs Non-Cash (Billions €)
                                                                                                                                                                                                                             320.00
                580.00
                                                                                                                                  400.00
                560.00
                                                                                                           600.00
                                                                                                                                  390.00
                                                                                                                                                                                                                             300.00
                540.00
                                                                                                                                                                                                                             290.00
                                                                                                                                  380.00
                                                                                                           500.00
                520.00
                                                                                                                                  370.00
                                                                                                                                                                                                                             280.00
                                                                                                           400.00
                                                                                                                                                                                                                             270.00
                                                                                                                                  360.00
                500.00
                                                                                                           300.00
                                                                                                                                                                                                                             260.00
                                                                                                                                  350.00
                480.00
                                                                                                                                  340.00
                                                                                                                                                                                                                             250.00
                                                                                                           200.00
                460.00
                440.00
                                                                                                                                  320.00
                                                                                                                                                                                                                             230.00
                                                                                                                                                                                                                             230.00
                                                                                                                                  310.00
                420.00
                                                                                                           0.00
                                                                                                                                     Jan 24
                   Jan 24         Feb 24          Mar 24         Apr 24         May 24          Jun 24     100.00                 330.00            Feb 24          Mar 24         Apr 24         May 24          Jun 24     240.00
                                                Group Balance vs Cash  Group Balance vs Non Cash                                                                  Group Balance vs Cash  Group Balance vs Non Cash
                                                                                                                                In North America the picture around collateral is quite different   •   North American market predominantly utilising cash collateral
                                                                                                                                from other models globally. The US market has traditionally   although use of non-cash is expanding.
             How we think about collateral and its role as the driver that   To summarise, in H1 2024, Collateral Markets were   revolved around cash collateral with an active market around
             underpins securities lending has evolved in line with the   marked by:                                             the reinvestment of cash collateral to generate incremental   •   Current regulatory ceiling on use of non-cash collateral,
             demands that we now place upon it. Traditionally, collateral   •   Non-cash collateral levels broadly stable through the   income for lending clients.                  especially around ERISA funds.
             was simply seen as a buffer or mitigant against loss if the   period.
             borrower was unable to return equivalent securities at the                                                        Fig 11 - S&P Global
             end of the trade. Today collateral often defines trades as   •   Both cash and non-cash collateral saw some seasonality
             lenders look to drive specific collateral outcomes to meet   during the period.                                                                     European Equity Market Cash vs Non-Cash
             their obligations around regulatory regimes such as uncleared   •   Half-year end balance sheet management appears to have
             margin rules for derivatives, or borrowers look to push high   played out almost exclusively through cash collateral trades.  60.00                                                                             180.00
             RWA assets off their balance sheet.
                                                               •   It is likely that non-cash trades could underpin regulatory     50.00                                                                                     150.00
             Globally, the relationship between cash collateral and non-  compliance structures and will be the last to be taken off as
             cash cash collateral is broadly evenly split, but there is more   balance sheets contract into the half year.         40.00                                                                                     120.00
             volatility in the cash collateral numbers. The reasons for this                                                     On-Loan vs Cash (Billions €)  30.00                                                         90.00 On-Loan vs Non-Cash (Billions €)
             may be varied, but cash is likely used to facilitate incremental
             trades, and borrowers may, at times, run out of eligible non-                                                         20.00                                                                                     60.00
             cash collateral. Also, regulatory nuances and historic market                                                         10.00                                                                                     30.00
             conventions also drive different outcomes in various markets.                                                          0.00                                                                                     0.00
                                                                                                                                     Jan 24         Feb 24          Mar 24         Apr 24         May 24          Jun 24

                                                                                                                                                                  Group Balance vs Cash  Group Balance vs Non Cash
                                                                                                                                The market in Europe has, for historical reasons, been one that   •   Europe is very much dominated by non-cash collateral with
                                                                                                                                has been built around the use of non-cash collateral although   over 80% of all collateral in the form of non-cash collateral.
                                                                                                                                we do see some cash collateral being used by some lenders. The   •   In line with other markets cash collateral appears to be more
                                                                                                                                availability of short-term investment opportunities in Europe has   volatile.
                                                                                                                                been a drag on the use of cash collateral.
   17   18   19   20   21   22   23   24   25   26   27