
Page 19 - 2808_24_Jan_ISLA_Market_Report_-_Aug_2024
P. 19
18 19
Securities Lending Market Report | H1 2024
Equity Markets in Focus
>>> Global >>> North America
Fig 6 - S&P Global Fig 7 - S&P Global
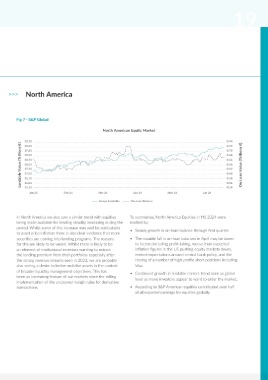
Global Equity Market North American Equity Market
28.00 1.40 20.50 0.74
Lendable Value (Trillions €) 26.00 1.00 On-Loan Value (Trillions €) Lendable Value (Trillions €) 19.00 0.68 On-Loan Value (Trillions €)
20.00
0.72
27.00
1.20
19.50
0.70
0.66
18.50
25.00
0.80
0.64
18.00
0.60
24.00
0.62
17.50
17.00
0.60
23.00
0.40
0.58
16.50
22.00
0.54
15.50
0.00
21.00
Jan 24
Jan 24 Feb 24 Mar 24 Apr 24 May 24 Jun 24 0.20 16.00 Feb 24 Mar 24 Apr 24 May 24 Jun 24 0.56
Group Lendable On-Loan Balance Group Lendable On-Loan Balance
The first six months of 2024 were something of a curate‘s Whilst disappointing in many ways it should be noted that In North America we also saw a similar trend with equities To summarise, North America Equities in H1 2024 were
egg for the lending of equities. On the one hand we saw an 2024 performance is coming off the exceptional highs of 2023 being made available for lending steadily increasing during the marked by:
increasing desire from institutional investors to lend securities and the first half of the year still delivered revenues of USD period. Whilst some of this increase may well be attributable • Steady growth in on-loan balance through first quarter.
as evidenced by the reported increase in securities being made 5.8 billion (EUR 5.4 billion) of revenues, the bulk of which was to asset price inflation there is also clear evidence that more
available to lend. However, this was tempered by falling year on returned directly to clients. securities are coming into lending programs. The reasons • The notable fall in on-loan balances in April may be down
year revenues as the market failed to reach the levels seen in To summarise, Global Equities in H1 2024 were marked by: for this are likely to be varied. Whilst there is likely to be to factors including profit-taking, worse-than-expected
2023. an element of institutional investors wanting to extract inflation figures in the US pushing equity markets down,
• Steady growth in assets being available for lending during the the lending premium from their portfolios especially after revised expectations around central bank policy, and the
Recently released data from S&P Global highlight an increasingly period, driven in part by price inflation of underlying asset the strong revenue streams seen in 2023, we are probably closing of a number of high-profile short positions including
crowded market with a reported 17% increase in all lendable values given the bullish markets in H1 2024 also seeing a desire to better mobilise assets in the context Visa.
assets to USD 37.9 trillion (EUR 35.5 trillion) chasing an almost of broader liquidity management objectives. This has
unchanged year on year global on-loan balance of circa USD • Securities on-loan essentially unchanged over the period been an increasing feature of our markets since the rolling • Continued growth in lendable mirrors trend seen as global
2.7 trillion (EUR 2.5 trillion). This market compression has been with some seasonality in late spring. implementation of the uncleared margin rules for derivative level as move investors appear to want to enter the market.
compounded by depressed year-on-year revenue streams across • Given the increase in the underlying value of lendable assets, transactions. • According to S&P American equities contributed over half
almost all asset classes. adjusted on-loan value, would be flat to down for H1 2024. of all reported earnings for equities globally.
Equity markets have reflected these global trends although • Growth in lendable combined with flat on-loan has
we have seen some regional nuances with Europe in particular compressed utilization and suggested a more crowded
posting significantly lower returns in the first half of the year. market.
Bright spots globally center around Asia where we saw strong
growth in equity markets, and we cannot ignore the Americas
equities markets that still delivered over half of revenues
attributable equities globally.