
Page 13 - ISLA_SLReport_Feb2020_spreads
P. 13
Another factor that may skew outputs into the year The reasons behind this trend are now well understood,
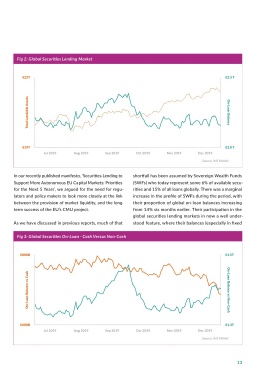
end, is the additional capital and balance sheet hurdles with banks often preferring to keep HQLA regulatory Fig 2: Global Securities Lending Market
that are placed upon the global systemically important driven non-cash trades open over the reporting date, and
banks (G-SIBs), who have to reduce funding to lower scaling back equity loans with lenders who are also pre- €22T €2.3 T
levels than their non-G-SIB peers. Due to the pre- ferring to return cash collateral to avoid having to engage
ponderance of G-SIBs in the securities lending mar- in reinvestment markets at a point when liquidity and
kets, some of the reductions in liquidity may be dis- investment opportunities could be limited.
proportionate, especially over key reporting dates.
Similar factors apply elsewhere. In the UK for exam- Typically, borrowers want to maintain regulatory driven
ple, the end of year bank levy will drive specific bal- HQLA trades over the year end as part of an active bal- Total Lendable Assets On-Loan Balance
ance sheet contraction amongst UK-based prudentially ance sheet management strategy, where the Liquidity
regulated banks. Coverage Ratio (LCR) is the primary binding constraint.
These trades are often collateralised with other securities
On-loan balances rose steadily by some 8% between which are themselves balance sheet efficient if pledged as
August and September, only to fall dramatically during collateral as part of a term HQLA trade structure. €19T €2.0 T
October. As will be discussed in subsequent sections, Jul 2019 Aug 2019 Sep 2019 Oct 2019 Nov 2019 Dec 2019
most of these movements related primarily to the equity In the second six months of 2019, we saw a marginal Source: IHS MArkit
securities lending markets. Amongst other things, a increase in both the absolute level and overall percent-
strong IPO market in North America especially around age of government bond lending, which increased from In our recently published manifesto, ‘Securities Lending to shortfall has been assumed by Sovereign Wealth Funds
cannabis offerings will have been a factor. The natural 44% to 47% of all loans outstanding as at 31 December. Support More Autonomous EU Capital Markets: Priorities (SWFs) who today represent some 6% of available secu-
unwinding of these positions, together with deleveraging for the Next 5 Years’, we argued for the need for regu- rities and 15% of all loans globally. There was a marginal
by hedge funds in response to outflows, may have con- As we will consider in more detail in the subsequent sec- lators and policy makers to look more closely at the link increase in the profile of SWFs during the period, with
tributed to the to the sudden decrease. tion, government bond lending was influenced by a num- between the provision of market liquidity, and the long their proportion of global on-loan balances increasing
ber of factors in the latter part of 2019, including the term success of the EU’s CMU project. from 14% six months earlier. Their participation in the
Another component could have been the widening of the liquidity shocks seen in the repo markets as well as the global securities lending markets in now a well under-
US Dollar/Japanese Yen basis spread in October, which re-emergence of buyback programmes by central banks, As we have discussed in previous reports, much of that stood feature, where their balances (especially in fixed
led to traders allowing loans of US Treasuries against as they sought to stimulate economic growth via mon-
JGB collateral to roll off as they became uneconomic for etary policy. Fig 3: Global Securities On-Loan - Cash Versus Non-Cash
borrowers. As we look more closely at the global trad-
ing book in the second half of the year, notably collat- The mobilisation and movement of collateral is one of
eral, we do see something of a more familiar pattern (see the most strategically important parts that our market €800B €1.5T
Fig 3). Institutions clearly prioritised non-cash trades can play in the context of waves five and six of the UMR
over cash collateralised ones, as they managed their later this year.
books down.
With some 32% of all government bonds held in lend-
The final contributory element that may have influ- ing programmes actually on-loan, this additional source On-Loan Balance vs Cash On-Loan Balance vs Non-Cash
enced the non-cash collateral data was the impact of of liquidity could be significant for the buy side as they
Japanese record date, which forced borrowers to switch seek to source high quality collateral to meet these reg-
from onshore cash borrows into offshore non-cash bor- ulatory obligations.
rows ahead of the September record date. This was quite
quickly reversed post 1 October. In addition, the previ- ISLA has highlighted for some time the disparity between €600B €1.3T
ously mentioned G-SIB balance sheet management exer- the scale of investments held by mutual funds (including Jul 2019 Aug 2019 Sep 2019 Oct 2019 Nov 2019 Dec 2019
cise will target non-cash borrows first to optimise both UCITS), and their actual participation in the lending mar- Source: IHS MArkit
short and long (collateral) legs. kets (see Figs 4 & 5).
12 13