
Page 15 - ISLA_SLReport_Feb2020_spreads
P. 15
equity collateral and government bonds raises some the broader aims and objectives of both of these regula-
Fig 4: Global Lendable Supply Value - By Fund Type
interesting questions. tory regimes, we are mindful they could push some par-
ticipants, notably smaller lenders away from the markets
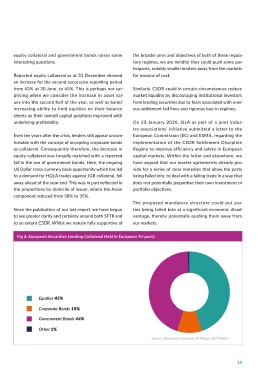
Reported equity collateral as at 31 December showed for reasons of cost.
Insurance Companies 6% an increase for the second successive reporting period
Banks/Broker Dealers 2% from 43% at 30 June, to 45%. This is perhaps not sur- Similarly, CSDR could in certain circumstances reduce
prising when we consider the increase in asset val- market liquidity by discouraging institutional investors
Govt/Sovereign Entities/Central Bank 6% ues into the second half of the year, as well as banks’ from lending securities due to fears associated with oner-
Corporations/LLP/LLC 4% increasing ability to hold equities on their balance ous settlement fail fines and rigorous buy-in regimes.
sheets as their overall capital positions improved with
Foundation/Endowment 1% underlying profitability. On 23 January 2020, ISLA as part of a joint indus-
Mutual/Retail Funds 48% try associations’ initiative submitted a letter to the
Even ten years after the crisis, lenders still appear uncom- European Commission (EC) and ESMA, regarding the
Pension Plans 18% fortable with the concept of accepting corporate bonds implementation of the CSDR Settlement Discipline
Undisclosed/Other 15% as collateral. Consequently therefore, the increase in Regime to improve efficiency and safety in European
equity collateral was broadly matched with a reported capital markets. Within the letter and elsewhere, we
Source: IHS MArkit fall in the use of government bonds. Here, the ongoing have argued that our master agreements already pro-
US Dollar cross-currency basis opportunity which has led vide for a series of clear remedies that allow the party
income markets) are an important source of trading and this our latest report, we are able to better understand to a demand for HQLA trades against JGB collateral, fell being failed into, to deal with a failing trade in a way that
market liquidity. As they look to build out their own cap- how the market uses collateral, but also what external away ahead of the year end. This was in part reflected in does not potentially jeopardise their own investment or
ital markets infrastructure on the global stage, we antic- factors can influence the type and form. Non-cash col- the proportions by domicile of issuer, where the Asian portfolio objectives.
ipate this proportion ti increase considerably over time. lateral still continues to be a predominantly European component reduced from 38% to 35%.
phenomenon, with over 96% of all non-cash collat- The proposed mandatory structure could put par-
It is now some six years since we began tracking the eral reported within our survey being held within the Since the publication of our last report, we have begun ties being failed into at a significant economic disad-
composition of non-cash collateral in more granu- European tri-party infrastructure. As at 30 December to see greater clarity and certainty around both SFTR and vantage, thereby potentially pushing them away from
lar detail. Since the inception of this report in 2014 to and detailed in Fig 6, the relationship between to an extent CSDR. Whilst we remain fully supportive of our markets.
Fig 5: Global Securities On-Loan - By Fund Type Fig 6: European Securities Lending Collateral Held in European Tri-party
Insurance Companies 6%
Banks/Broker Dealers 12%
Govt/Sovereign Entities/Central Bank 15%
Corporations/LLP/LLC 4%
Foundation/Endowment 1% Equities 45%
Mutual/Retail Funds 17% Corporate Bonds 10%
Pension Plans 25% Government Bonds 44%
Undisclosed/Other 20% Other 1%
Source: IHS MArkit Source: Clearstream, Euroclear, JP Morgan, BNY Mellon
14 15