
Page 31 - ISLA_SLReport_Sep2019
P. 31
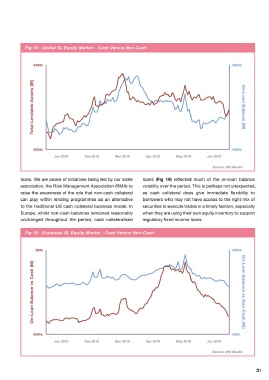
Fig 16 - Global SL Equity Market  Fig 18 - Global SL Equity Market - Cash Versus Non-Cash


 €14,000k  €1,100k  €480k                                                           €650k


 Total Lendable Assets (M)  On-Loan Balance (M)  Total Lendable Assets (M)              On-Loan Balance (M)


 €10,500k  €825k  €350k                                                             €500k
 Jan 2019  Feb 2019  Mar 2019  Apr 2019  May 2019  Jun 2019  Jan 2019  Feb 2019  Mar 2019  Apr 2019  May 2019  Jun 2019
 Source: IHS Markit                                                          Source: IHS Markit

 increase in on-loan balances through May into early June,   the preponderance of non-cash collateral to increase over   loans. We are aware of initiatives being led by our sister   loans (Fig 19)  reflected  much  of  the  on-loan  balance
 indicating some seasonality across the market.  time, it has been stuck at around 60% globally for some   association, the Risk Management Association (RMA) to   volatility over the period. This is perhaps not unexpected,
 time now. This relationship did not change significantly   raise the awareness of the role that non-cash collateral   as  cash  collateral  does  give  immediate  flexibility  to
 The role played by non-cash collateral, particularly in   during the first six months of the year (Fig 18)  can play within lending programmes as an alternative   borrowers who may not have access to the right mix of
 fixed income markets is now well understood. In equity   to the traditional US cash collateral business model. In   securities to execute trades in a timely fashion, especially
 markets, we have seen a constant drift towards the use   In North America, non-cash collateral remains around   Europe, whilst non-cash balances remained reasonably   when they are using their own equity inventory to support
 of non-cash collateral as well. Although we would expect   46% to 47% of all collateral pledged in respect of equity   unchanged throughout the period, cash collateralised   regulatory fixed income loans.

 Fig 17 - European SL Equity Market  Fig 19 - European SL Equity Market - Cash Versus Non-Cash


 €2,300k  €280k  €80k                                                               €200k

 Total Lendable Assets (M)  On-Loan Balance (M)  On-Loan Balance vs Cash (M)            On-Loan Balance vs Non-Cash (M)


 €1,900k  €0k  €20kk                                                                €50k
 Jan 2019  Feb 2019  Mar 2019  Apr 2019  May 2019  Jun 2019  Jan 2019  Feb 2019  Mar 2019  Apr 2019  May 2019  Jun 2019
 Source: IHS Markit                                                          Source: IHS Markit


 30                                                                                          31